
What if you knew how much business a new customer would bring in? Specifically, if you could tell how much a potential customer would deposit, borrow, the number of credit/debit transactions, and other fees generated before they even walked in the door.
That’s the capability that predictive lifetime value (pLTV) promises.
We’ve covered the process of looking backward at how much business or lifetime value you already have with an individual or collective customer. A trailing view of the relationship you’ve had over years can be a helpful indicator of where it is headed.
But how likely is that to continue?
If there are contractual obligations, like subscriptions to services, future revenues can be trivial to forecast. However, predicting any given account’s future is more challenging if the activities that generate revenue are uneven in frequency or size (like debit card transactions, account balances, loan originations, etc.).
Originally introduced in 1987, pLTV is the practice of applying statistical models to customer behavior. Wharton professor Peter Fader is credited with advancing the state of the art in a wonky academic paper and an easier to consume book. Beyond technical terms like Pareto/NBD, the idea is to apply mathematical models to a series of transactions over time to predict how that pattern might or might not continue in the future.
Retailers and e-commerce have largely embraced the methodology to help drive their acquisition strategies and rationalize tactical decisions like which customers to offer discounts to acquire or entice a repeat purchase. Ready made models like Buy Till You Die have made this accessible and easier to apply to more diverse problems than giant retailers.
There are other considerations for banking, like creating models to predict interest income, but the overall concept applies. Look at the data you have about your individual customers, build a model on a subset of customers, test the model’s performance on the holdback, and apply it to your forecasting and planning if it produces something with reasonably minor errors.
Knowing what your customers will likely do can help provide important, but elusive, answers to critical questions.
For example, look at the latest FDIC Quarterly Banking Profile.
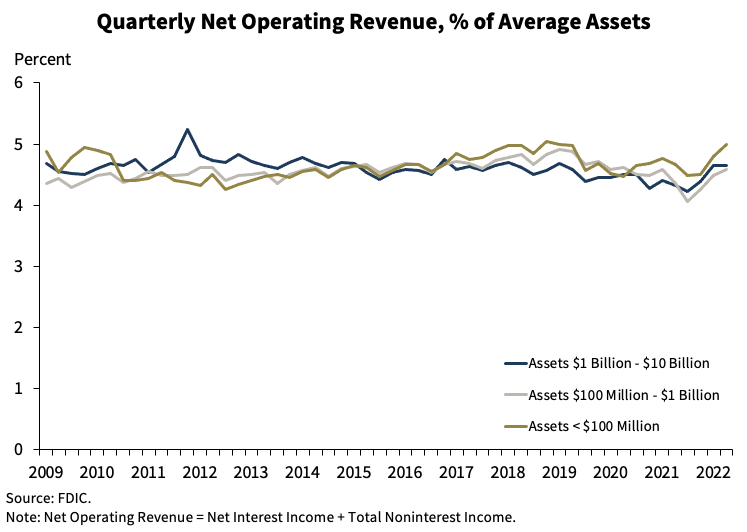
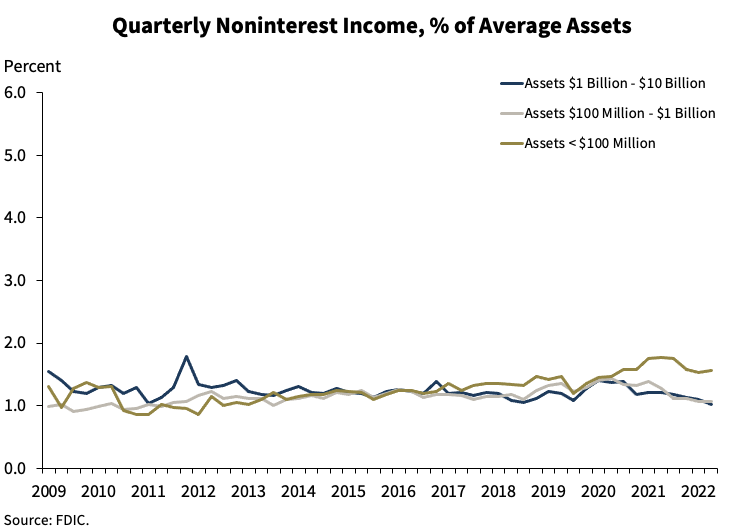
For covered banks under $10B in assets, net operating revenue has run about ~4.5% of assets and noninterest income ~1% of assets. At institutions of this size, 20-25% of income comes from the more diverse source covered on noninterest income.
What, in aggregate, would be the impact of a regulatory cap on something life NSF fees? You’d have to look at the portion of noninterest income is made of those fees, and what the trend those fees are taking.
A more helpful approach might be to have a pLTV model of your customers that breaks this out. Looking at the history of fees assessed at a transactional level would allow you to create a view of future fee assessments. More so, this would be at the individual customer level, allowing you to see segments of customers and group trends. How would customers like this shake out in relative size? Would this change your math on acquisition and retention? Is there a different segment of customers you could focus on to replace or surpass that lost income?
This approach is useful for tactical decisions like setting ceilings for customer acquisition costs. An aggregate view of LTV can also inform major strategic decisions like your budget. Quoting from Neil Hoyne’s excellent book on the topic Converted:
Adding up the lifetime value of your individual customers gives you a pretty good estimate of how much your entire customer base is worth to the business, a metric known as customer equity. And CFOs are starting to pay attention. The metric is more credible than the claim that Marketing simply drove every sale that period, while finally recognizing those longer-term investments that are paying off to keep relationships alive and healthy. You’ve put in the work. Use the results to build your case for a bigger budget, bring the efforts of product and sales teams into closer alignment with yours, and lift the commitment to marketing in your company.
If you want to explore this idea and how it could impact your customer relations, reach out. We have the experience and methodologies that get you started quickly to test the approach and scale up to maximize your return and impact with customers, vendors, and, most importantly, your bottom line.