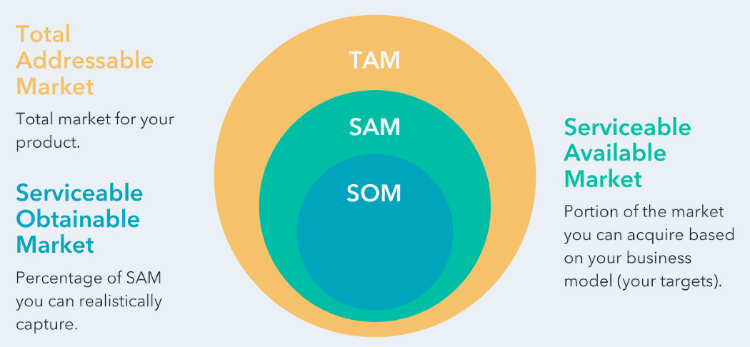
There are different takes and acronyms on estimating a market, but let’s use Hubspot’s definition above. The place to start is the total addressable market or TAM.
When determining the size of a market for community banks and credit unions, or any business for that matter, you start with essentially “everyone.” And by everyone, it’s who could actually deposit or borrow from you or be “addressed” by your services. It could be the total number of people who live or work in your geographic footprint or fits your field of membership. For your business lines, like an SBA 7(a) program, it might be every business in the US that matches the program requirements or industry vertical you’re targeting. But in short, everyone.

And that’s the big circle in the diagram above.
You may have an established process for doing this. It might be driven by survey data like the Census Bureau’s annual ACS dataset, which is good for identifying trends like which age groups might be growing faster.

But this just scratches the surface. Jared Sleeper at Matrix Partners writes on the next level of analysis to develop a real business case for your FI or product line.
There are three distinct ways to calculate TAM:
- Top-down, using industry research and reports.
- Bottom-up, using data from early selling efforts.
- Value theory, using conjecture about buyer willingness to pay.
Data like ACS can give you a reasonable basis for #1. Alternatively, #2 looks at your traditional performance, particularly the regular branch-level unit economics (foot traffic, assets, transactions, etc.).
Where it gets interesting and potentially game-changing for you is #3. Value theory can help look at where your customers/members might have a problem you could help with.
This approach often comes to the fore when companies are considering expanding their core product and cross-selling into existing customers as part of a long term strategy. Many [business cases] include some version of this, implicitly or otherwise, because big parts of the product are yet to be built. What is helpful is that this approach helps management teams show that they are thoughtful about what customers find valuable and are willing to pay for.
Taking all three approaches and potentially coming up with three or more different numbers is useful. Looking at the assumptions and points of view from the different methods can highlight each approach’s relative strengths, weaknesses, and risks. Having those elements listed explicitly and then tested as part of your go-to-market is critical to faster learning and, ultimately, higher ROI.
In future posts we’ll cover Service Available and Service Obtainable Markets.
Even if you have a well-defined or official “#” that you use for your market, going through this process at least annually can help identify new opportunities or where you’re gaining/losing ground against competitors. And if you’re not sure where to start and need help, reach out. We’re here to help or point you in the right direction to get ahead and better serve your communities.
