
This is part 2 of 3 of our discussion on market size. This part follows our first post on Total Addressable Market (TAM). We now turn our attention to Serviceable Available Market (SAM).
SAM further focuses your view of the market by looking inside out, or how much of the “everyone” of TAM you could reasonably serve. If using your branch footprint, this might be segment populations of a zip code or in the “5-mile” rule of thumb.

Your available market might also be specific customer profiles like recent graduates, single people moving to your community for a job, households with more than five members, etc. When you look through the lens of market share, this number will be the denominator of that calculation.
Let’s look at Wikipedia’s definition for clues:
The serviceable available market or served addressable market is more clearly defined as that market opportunity that exists within a firm’s existing core competencies and/or past performance. The biggest consideration when calculating SAM is that a firm most likely can only service markets that are core or directly adjacent to its current customer base.
You will need a realistic plan for touching this entire customer set, from direct response to broad brand awareness. This group will be everyone you possibly could serve with the offerings, marketing reach, and infrastructure you have today.
Narrowing the description of your TAM down to this level is where the value of this exercise comes into place.
Who do you exist for?
If your SAM is equal to or very close to your TAM, you implicitly say you serve everyone. Maybe that’s couched in a geographic footprint, but you’re looking at that broad market, also served by the big nationals, fintech, neobanks, etc., and saying, “Yes! We can not only satisfy but delight the diverse needs of this audience.”
This is the sweet siren song of the bigger market. “Oh, if we only get 1, 2, 5, or 10% of this market, we’ll meet all of our goals”.
But here lies the danger. It’s a trap to think that capturing a smaller share of a bigger market is easier than a larger share of a smaller market.
The reason this is not true is the problem of fit. Trying to address all of the diverse needs of a broad market often leads to, quoting Seth Godin, “average products for average people.” And there are no average people.
Even behemoths like J.P. Morgan Chase, which effectively serves “everyone,” take great pains to focus their offerings on their target markets.
Radhika Duggal, Chief Marketing Officer of fintech Super, in her discussion with MarketingSherpa’s Daniel Burnstein recounts her time as product manager for Chase’s offering for unbanked consumers.
So I live in New York City. I stood outside Western Union’s and Pay-O-Matics and asked customers of those institutions, Why are you here? What is the benefit of being here? Hey, do you know you can get this service at a bank? I really just wanted to understand why people made the choices they made what they needed from that institution. And I was so able to take that knowledge back to my work at Chase and figure out how to work that into either the product with our product team or the messaging.
So pick the specifics. You may have several segments you address, but get it down to something you can count or estimate with some confidence. If it’s restaurant checking and payment processing, then define that. Count them. If primary checking, bill pay, and college savings for married households with 2+ children at home. Great. Put a number on that.
It’s helpful to have a few layers to this exercise. In the restaurant example above, you can start with eaches, say, the number of restaurants within a county or zip code boundary. Then look to specify by size -> either estimated revenue, seating, weekly plates, or something that essentially counts or reflects the opportunity more for a restaurant that’s twice as big on one of these measures. This specificity level will pay off later in designing a strategy to win share.
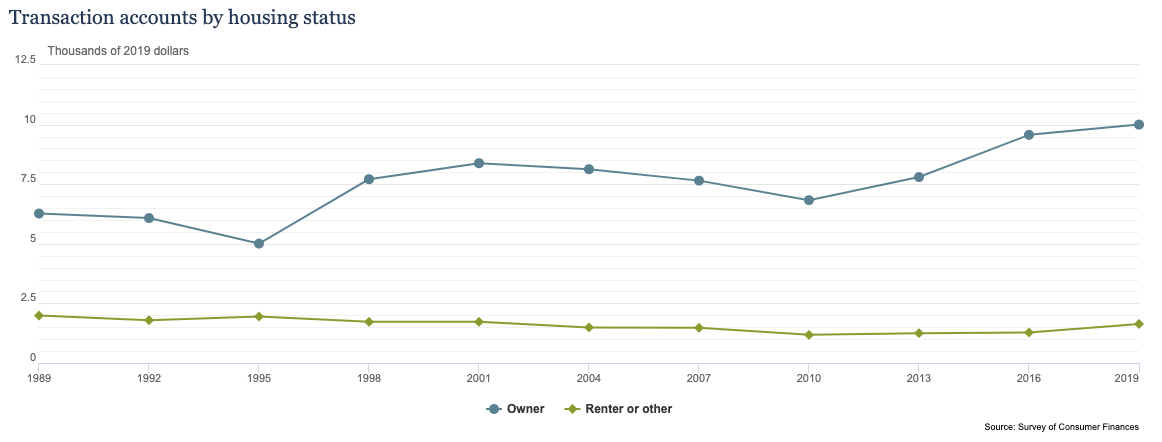
For a combined view, it may be helpful to dollar denominate all this. Grouping to an estimate of interest/non-interest income or gross asset level (per account/household/business/etc.) is a way that will help tie actual performance back to your model. The Federal Reserve’s Survey of Consumer Finance (SCF) is a great historical view and detailed trends in this area.
The real value of an exercise like this is to force you to pick your battles. To win in today’s consumer and small business banking market as a community FI, you can’t be “for everyone.” Deliberately decide where you will put all your effort into standing out and winning.
Look for our final post in the series on Service Obtainable Markets, or what share of your service available market you are aiming to capture, and tying it all together.
Want to dig into market data deeper and refine your opportunity definition? Reach out. We have a collection of approaches and catalogs of data to help refine and guide your go-to-market and growth planning.