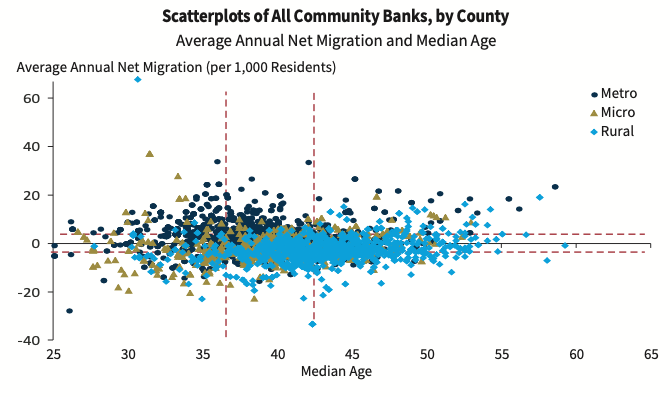
Is the average age of your customers/members declining, increasing, or staying the same? How does that compare with the population of your served communities?
If you’re like most community institutions, you average age is both higher and aging faster than the general population.
If you suspect or know that your customers are aging out, the next question is by how much. Benchmarking your customer or member population against the population of the communities you serve can provide insight.
The best place to start is with the Census Bureau. Begin with their annual American Community Survey (ACS) survey. Their data sets provide population, inflows, and outflows at the county level by age groups.

A comparison to general population size and growth by age groupings will give you a rough view of your market share.
Beyond Census data, the US Chamber of Commerce publishes research and economic data sets.
From there, look at your state level government. For example, The North Carolina Department of Commerce collates detailed reports and data for more contextual information like employment data, business start, and real estate planning/permitting.
In conjunction with the FDIC and Conference for State Bank Supervisors, the Fed publishes detailed research and annual survey data on community banking. Each agency also publishes independent research, like this report on community bank growth and local population inflow/outflows from the FDIC.

With a clearer look at the changing demographics or your addressable opportunity, you will be better positioned to focus and segment your acquisition and retention efforts where it will be the most effective. If you have questions or want help preparing for your next budget cycle, reach out; we’re here to help.
